Healthcare is usually drawn as a chain: a patient sees a provider, the provider bills a payer, the payer pays. That picture is tidy, and it is wrong in the ways that matter most. The industry is a web, with many kinds of stakeholders bound together by hundreds of distinct relationships. Many of the strongest forces in that web act between parties who never deal with each other directly.
Programs that treat the web as a chain tend to fix one link and get surprised by the others. This note describes what the web looks like and argues for a simple discipline: before designing anything, name every relationship it touches, precisely.
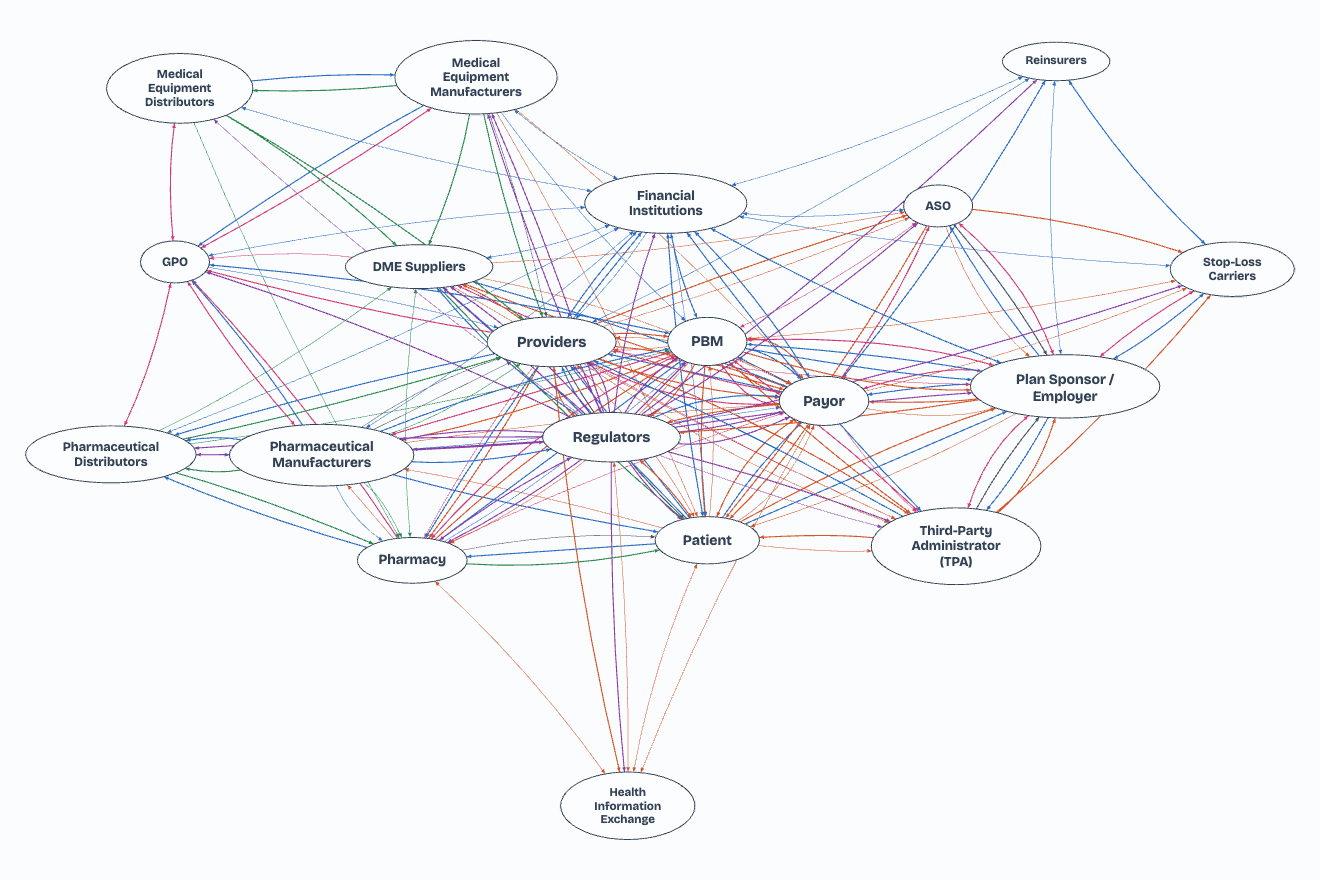 Interactive map
The web is dense
A map of 19 high-level stakeholders finds 256 distinct interactions across the 171 possible pairs. Patients, payers, PBMs, TPAs, ASOs, employers, stop-loss carriers, reinsurers, providers, pharmacies, GPOs, manufacturers, distributors, DME suppliers, HIEs, financial institutions, and regulators are all in it.
| Measure | Count |
|---|---|
| Stakeholder categories | 19 |
| Possible pairs | 171 |
| Distinct interactions | 256 |
| Direct interactions (primary + secondary) | 189 |
| Pairs with no direct relationship | 67 |
| Interaction types (claims, rebates, risk transfer, compliance…) | 24 |
| Links where one interaction shapes another | 302 |
What stands out is that the hubs are not only where people expect. Providers (38), regulators (37), and payers (36) lead, but PBMs (32) sit in more direct interactions than pharmacies (23) or manufacturers (22), and employers (26) rival patients (28).
The web overlaps
The categories are clean on paper and blurred in practice. One corporate family can hold several roles at once, and each role carries different incentives.
- Payer, PBM, and pharmacy. A large insurer may own a PBM, which owns mail-order and specialty pharmacies, which run a rebate GPO. A price set in one role is revenue in another.
- Payer and administrator. The same carrier sells fully insured policies, administers self-funded plans under ASO, rents its network to TPAs, and may sell the stop-loss that sits behind them.
- Provider and payer. Health systems run their own plans, take capitation, and buy provider excess reinsurance, so they bear risk as well as deliver care.
- Pharmacy and DME supplier. Many pharmacies are also enrolled DME suppliers, billing one product under the pharmacy benefit and another under the medical benefit.
- Regulator and payer. Government is both the rule-maker and, through Medicare and Medicaid, the largest single purchaser of care.
Overlap matters because it changes the question. It is rarely enough to ask what a PBM wants. The useful question is what this entity gains across every role it plays in this transaction.
The strongest forces act at a distance
The web’s most consequential feature is indirect influence: one relationship changing another between parties who never meet. The map records 302 such links. Take the moment a patient pays for a prescription. On the surface it is a two-party exchange. Underneath, at least four other interactions set the price.
The patient deals only with the pharmacy, yet the amount paid is decided by a manufacturer, a PBM, and a payer. The same pattern runs across the web. Medicare fee schedules anchor commercial rates. Stop-loss renewals follow specialty drug prices. FDA approval gates every downstream product flow. Even the 67 pairs with no direct relationship are rarely unconnected; a reinsurer and a drug manufacturer never sign a contract, but high-cost drug claims drive reinsured losses.
Why naming comes first
Most program failures in healthcare are not failures of execution. They are failures of description: the program was designed against a relationship that was named too loosely. “Payer–provider relationship” is not a design input. “Prior authorization request for an outpatient MRI, provider to payer, via X12 278, governed by the CMS prior authorization rule” is.
Precise naming does four jobs:
- It separates relationships that look alike. A rebate, an admin fee, a chargeback, and a DIR fee are all price concessions, but they flow between different parties, on different schedules, under different rules. A program that lumps them together will misprice something.
- It exposes who is actually affected. Naming the flow (money, data, product, contract, service, or rules) and its direction shows who pays, who decides, and who absorbs the change. A shift in PBM reimbursement lands on pharmacies, then on patients, then on employers’ renewals.
- It reveals second-order effects before launch. Once each interaction is named, the indirect links can be traced. A copay assistance program looks generous until accumulator data shows it never counted toward the deductible.
- It gives teams a shared vocabulary. Clinical, finance, IT, compliance, and partners can point to the same named interaction rather than arguing past each other about “the claims process.”
A practical method
A relationship is named well when it answers six questions. Each row of a stakeholder map should carry all six.
| Question | What to record | Example |
|---|---|---|
| Who? | The two stakeholder categories, not company names | PBM ↔ Pharmacy |
| What? | The interaction type | Claims & adjudication |
| What moves? | Money, data, product, contract, service, or rules | Data |
| Which way? | Direction of the flow | Pharmacy → PBM |
| How? | The standard, contract, or instrument that carries it | NCPDP D.0 claim |
| Shaped by what? | Other interactions that influence it | Network rates, eligibility data, e-prescriptions |
The example is modelled on one row of the map: open it.
Then work in this order:
- Fix the cast at the category level. Start with stakeholder types, not named organizations, so the map stays stable while partners change. Drill into subtypes only where they behave differently.
- Walk every pair. Nineteen stakeholders make 171 pairs. Going through each one surfaces relationships that intuition skips, and marking the indirect ones is as useful as listing the direct ones.
- Split each pair into its distinct interactions. One row per interaction, never one row per pair.
- Trace the influence links. For each interaction a program will change, list what shapes it and what it shapes in turn.
- Design against the named rows. Scope, metrics, contracts, and data requirements should point back to specific interactions on the map.
The first move
The healthcare web will not get simpler. Ownership keeps consolidating roles, regulation keeps adding rules to existing relationships, and new players keep inserting themselves between old ones. A program cannot control that web, but it can see it clearly.
Naming each relationship precisely, including who is involved, what moves, which way, how, and under whose influence, turns a tangle into a map. Every later decision about scope, partners, incentives, and data depends on that map, which is why drawing it is the first move.